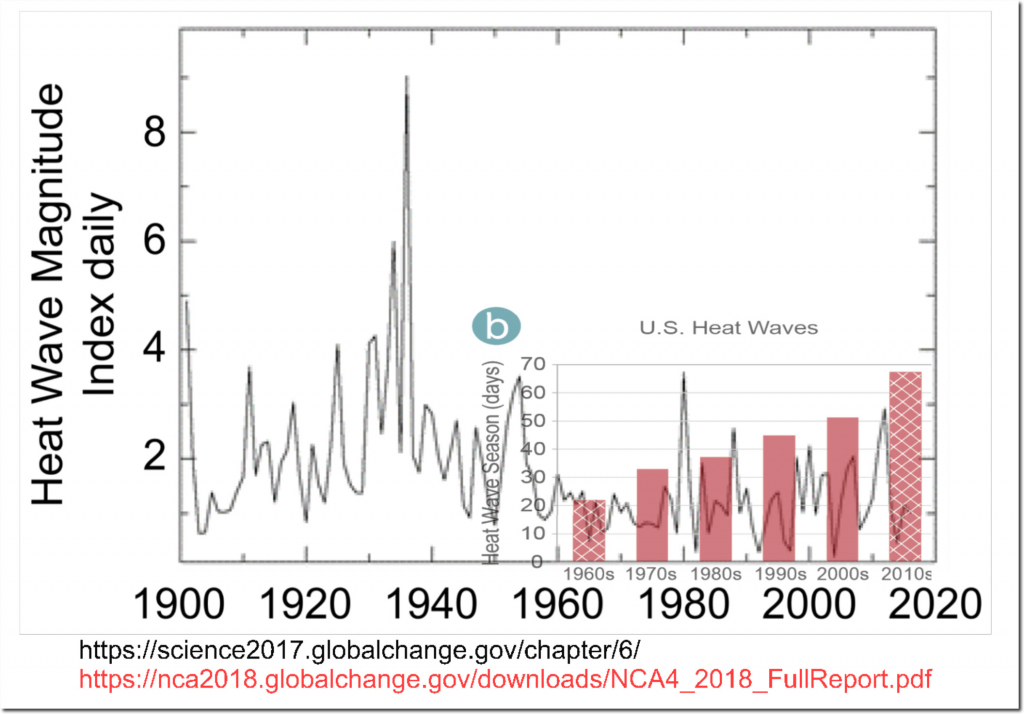
Yesterday I showed how the National Climate Assessment is committing blatant fraud about heat waves, by hiding the data which shows their claims are inverted from reality.
Extreme Fraud In The National Climate Assessment | The Deplorable Climate Science Blog
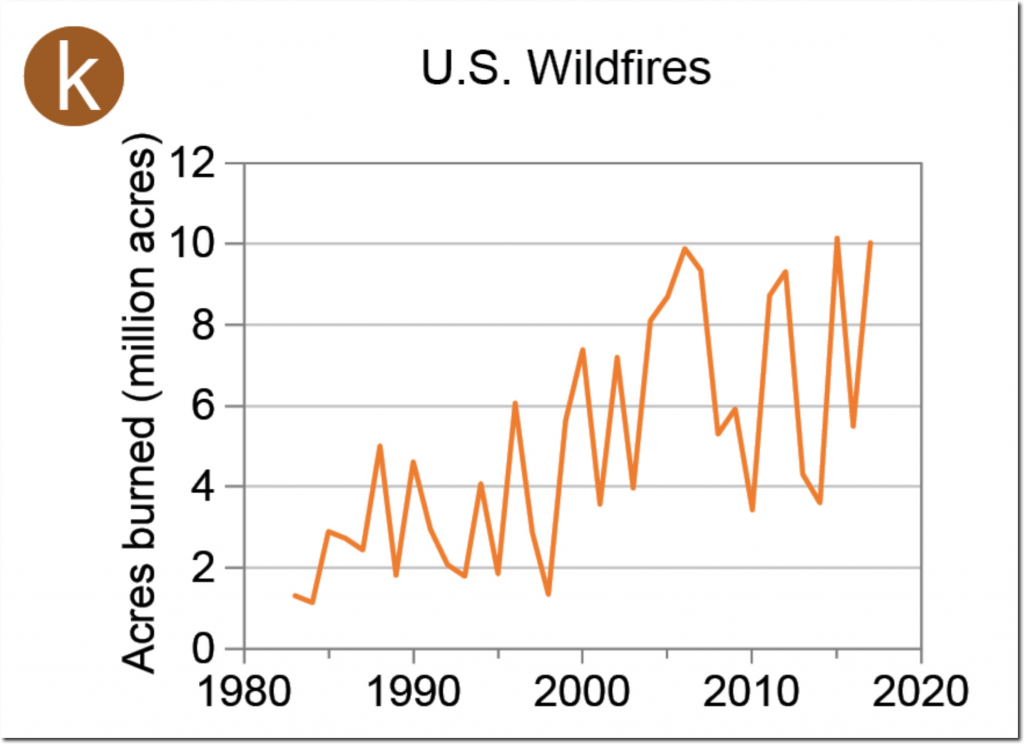
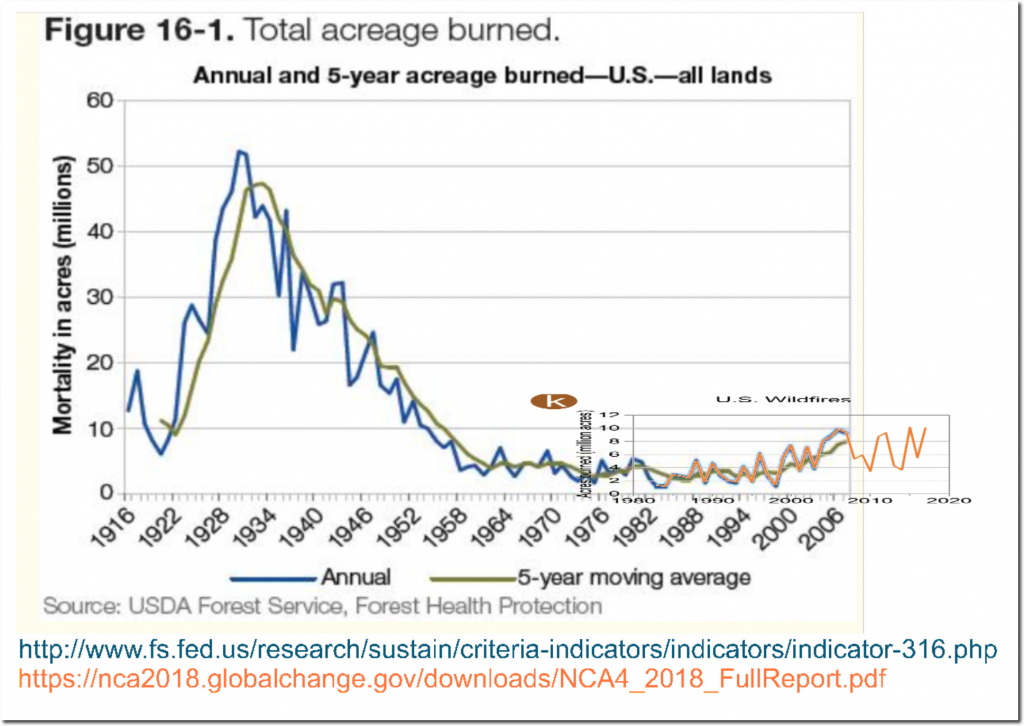
In this post, I show how they are doing exactly the same thing with wildfires. They show US burn acreage rapidly increasing.
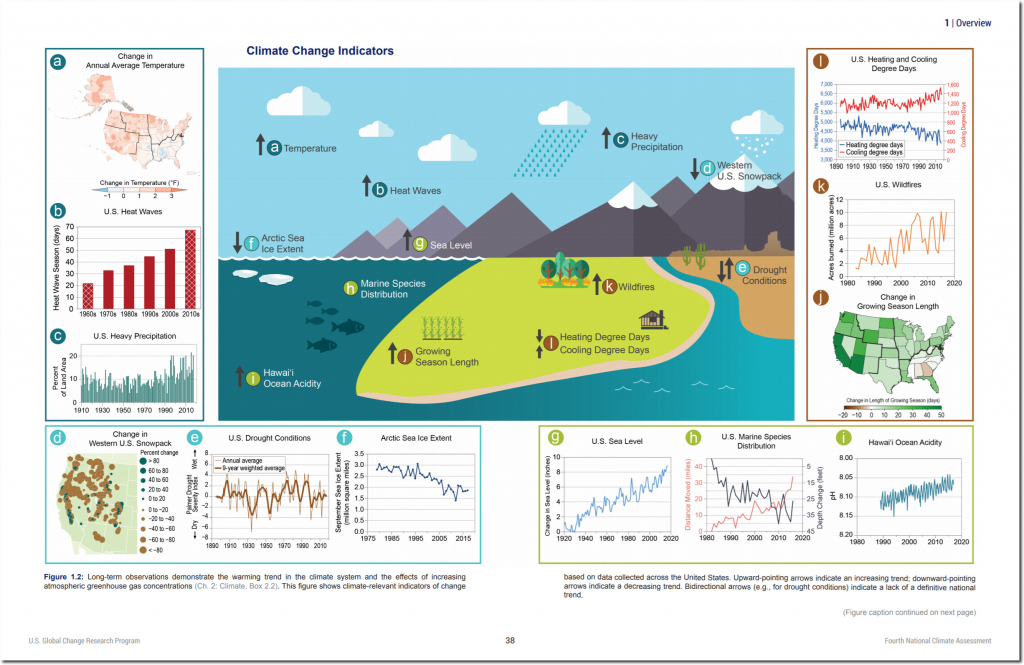
The graph was taken from page 38 of the Fourth National Climate Assessment document released in November 2018.
Fourth National Climate Assessment, Volume II: Impacts, Risks, and Adaptation in the United States
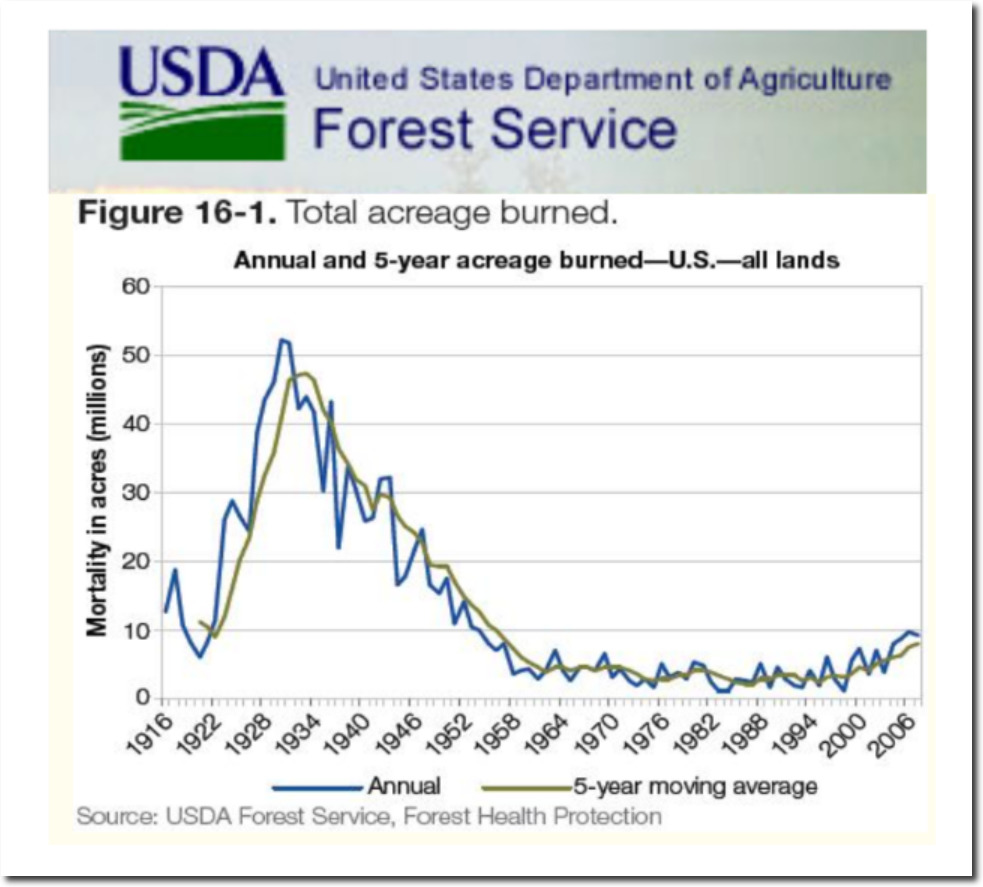
But why did they start their graph in 1983? The US has very detailed burn acreage data going back for more than a century, and it was much higher prior to 1970.
Indicator 3.16: Area and percent of forest affected by abiotic agents
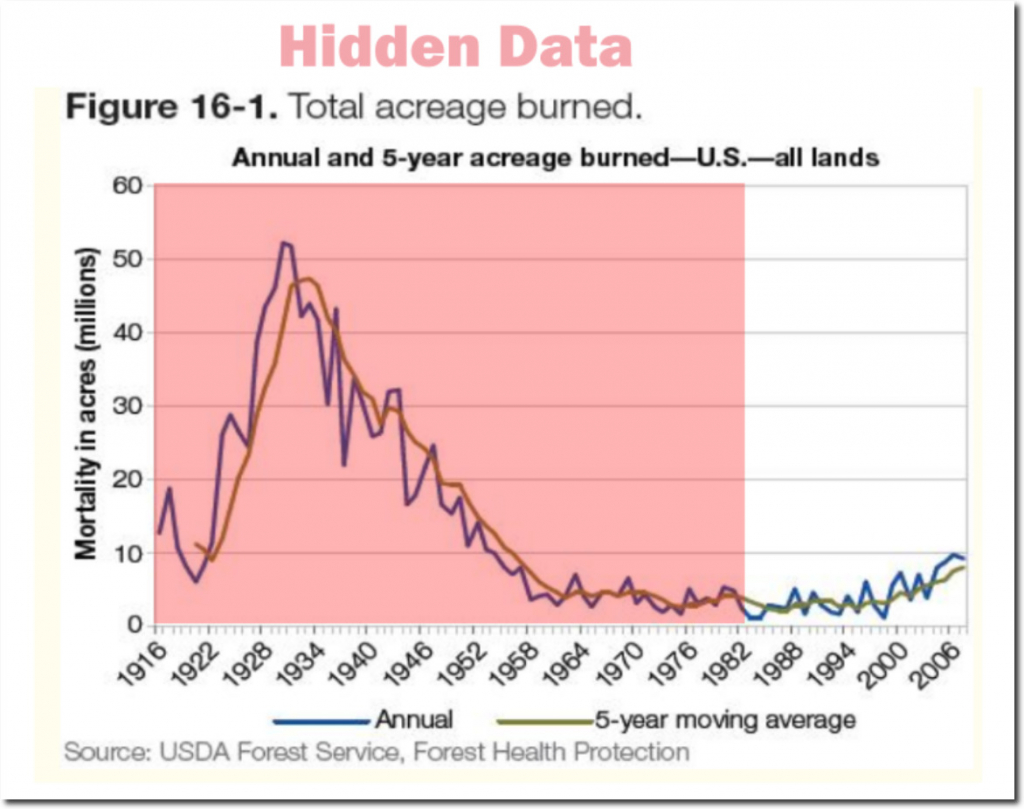
I overlaid the National Climate Assessment Graph on the Forest Service graph, and it becomes clear exactly what they are doing. Like in the the heatwave graph, they picked the lowest point for their start date, so that they could show an upwards trend – and deceive the public.
They hid essentially all of the essential data, which shows that burn acreage is down 80% in the US over the past 90 years.
Burn acreage was very carefully tracked and reported during the 1930s. People split the atom and built the Golden Gate Bridge during the 1930s. It is not surprising that they also knew how to do the basic mathematics which climate scientists seem to be incapable of.
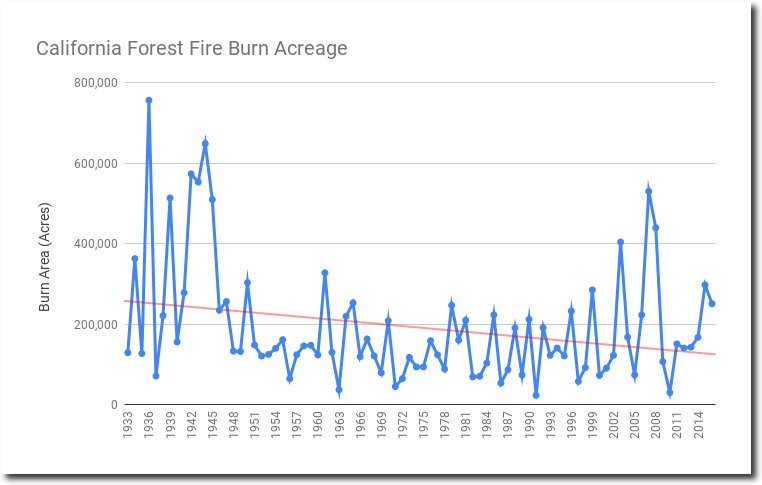
The same story in California. Last year had very high burn acreage, but the trend since the 1930’s is generally down.
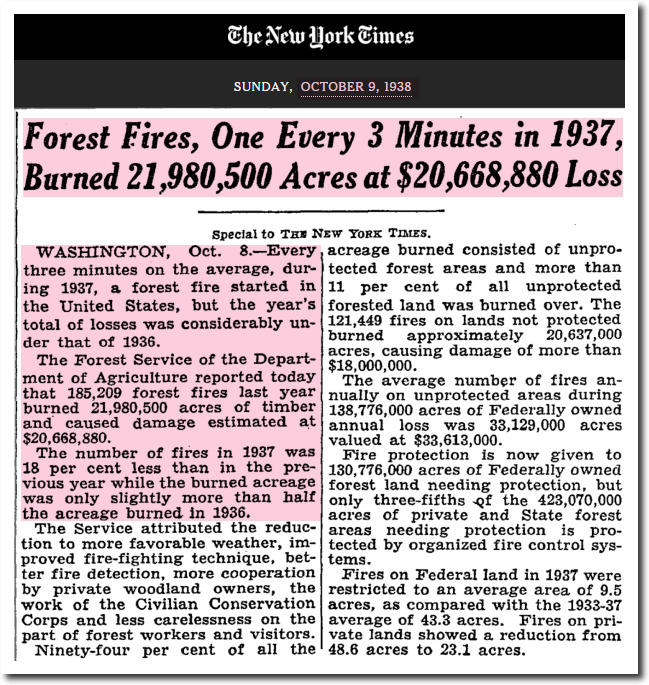
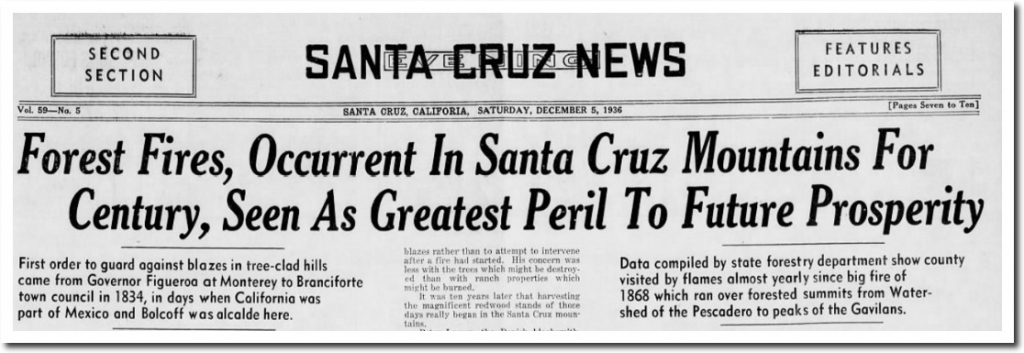
In 1936, forest fires were seen as the greatest threat to prosperity.
05 Dec 1936, Page 7 – Santa Cruz Evening News at Newspapers.com
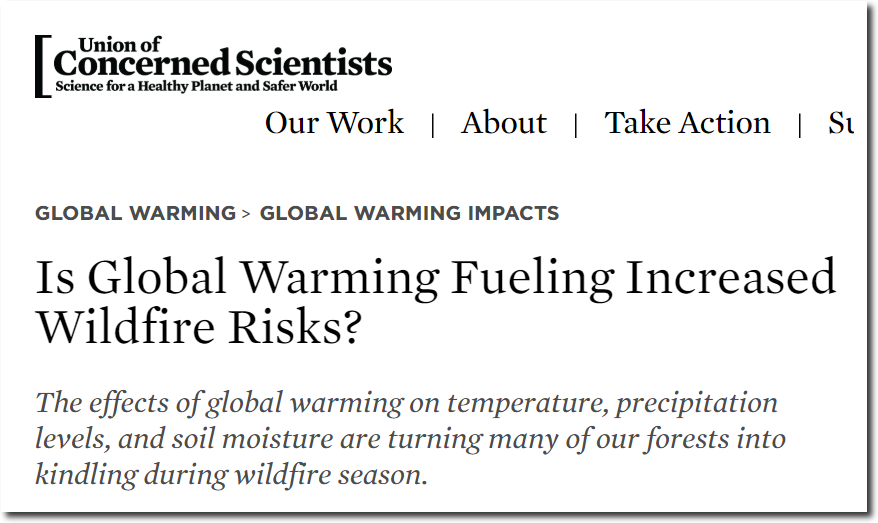
And as always, the fraudulent work of the National Climate Assessment is backed by many other fraudsters, like the Union of Concerned Scientists.
Is Global Warming Fueling Increased Wildfire Risks? | Union of Concerned Scientists


Tony, thanks for all you do! Please read Is the “Green New Deal Impossible?” https://historynewsnetwork.org/article/171258
It compares the abolitionist movement to show how something which is nearly impossible can be overcome by moral suasion.
My comments I posted regarding that article:
So then… It took about three decades for the moral suasion of the abolitionists to bear fruit. This was for a goal with a clear foundation in our founding document: “All men are created equal”, although it took a while to get around to that.
In contrast, moral suasion of carbon as the boogeyman — started not by scientific inquiry but rather, political motives which have nothing to do with science — will be seen as a house of cards which will fall over a similar period of time — three decades — as the earth will be well into its natural cooling cycle which has already begun.
Scientific inquiry as practiced by independent thinkers will prevail over the science bastardized by federal funding to determine not what is truth but rather “here’s a stash of money if you can prove man is responsible”, with a heavy price paid by those scientists who would dare to question the mantra.
Real science — using the scientific method and with normally encouraged skepticism to test hypotheses, using actual empirical data rather than manipulated data to satisfy POLITICAL objectives — will prevail over corrupted science.
This fraud will be exposed for what it is, and future generations will laugh at this, much the same as we look back on using leeches to bleed poison out of sick people.
Habemus Papam
http://www.summitcamp.org/status/webcam/
Tony, OT, but of interest:
“GHCN v3.3 Stations By Altitude By Years (or “Mountains? What Mountains?”)
“ALL the “warming” is in the “adjustments” and in “The Reference Station Method” of making up non-existent grid-cell “temperatures”.
https://chiefio.wordpress.com/2019/02/12/ghcn-v3-3-stations-by-altitude-by-years-or-mountains-what-mountains/
It’s good that someone is talking about this again, but it has long been known that warming was created out of thin air by eliminating stations at higher altitudes, higher latitudes, and in rural locations.
http://www.youtube.com/watch?v=58mDaK9bH5o&feature=player_embedded
Here is a real example from CA what fuels forest fires…and it is caused now by Global Warming…
Gosh! If the national climate assessment is to be believed, burn acreage is so sensitive to temperature that there must have not been any forests in America at all during the medieval warm period.
Don’t you know that the Sahara was formed by a giant wild fire. Snicker.
They don’t care what we say. They know the young and gullible will only hear that GW is real and that man is to blame. As Goebbles said, if you repeat a big lie often enough the people will eventually believe it.
What no hat tip for this?
I’ve blogged this topic numerous times. But thanks for the reminder
https://realclimatescience.com/2017/10/crooked-little-girl/
Thanks Tony
Please Tony the deceit evident in the climate assessment surely deserves a video. I know that would be solid evidence to my friends that they are being sullbhitted too and taken for fools.
The rise since the 80’s has very likely been due to increasingly poor forest management, caused by guess who?
Poor forest management is a indeed major cause, and the threat has been known for decades. I remember Yosemite Park staff warning in the 1960s about the fire hazard caused by dead and dying trees accumulating in the forest. Ditto public lands officials in Colorado during the 1970s. Dead wood accumulated because wildfires were extinguished asap in the 1960s, 1970s and other decades. Also, forest products companies were banned from removing dead and dying trees from public lands throughout the West. Thoughtful people knew the accumulating dry wood would eventually fuel uncontrollable wildfires, and it has since the mid 1980s.
Dave, I agree. The gradually increasing burned acreage in recent decades has nothing to do with “climate change”. It has everything to do with poor forest management policies.
Bryan,
TY for the comment.
Another NON-climate contributor to U.S. wildfires is non-native vegetation, particularly ground covers. Such vegetation can sprout and grow quickly in burned and cut over areas. Some varieties become high fire risks within several years. And, they burn HOT.
In addition to contributing to more frequent, hot fires, the non-native plants suppress native trees, bushes and other vegetation. The non-native plants impede the sprouting of native vegetation. More frequent, hot fires kill sprouts and saplings.
There is another major factor. Weather! the last two springs in California were wetter than average. The extra moisture provides for a spurt of growth for annual vegetation. That vegetation dies and dries out during the summer and provides for greater than normal tinder for fires. Joe Bastardi accurately predicted active fire seasons for the state based on that factor.
Wildfires don’t seem to be hurting the GLOBAL GREENING that’s happening.
Here : https://www.carbonbrief.org/one-third-worlds-new-vegetation-in-china-and-india-satellite-data-shows?fbclid=IwAR11pw85dRoGtxywSiow8xcHsjYFwtBhVyIKxwloy-kE9roWA7gX_xS-CnU
For anyone interested in a detailed discussion on fire reporting, the EPA report below is pretty good. There is a lot of uncertainty in the reporting for various reasons, including up to 75% of wildfires are reported by non-federal state and local agencies, with some duplication. Reporting took off in the mid-1980s, along with the trend line in the above graphs, with the advent of Incident Command System reports to the NICC. There is a linked video (long and technical) by Karen Short of the USFS that details historical source reports for wildfire, and how they have changed over the years. For example, BLM did not report their burn acreage until 1964.
https://www.epa.gov/sites/production/files/2016-08/documents/wildfires_documentation.pdf